- tensorflowを使った画像分類の実装方法
今回はtensorflowを使ってmnistの画像分類をやっていきます。
DeepLearningのチュートリアル的な内容となります。
事前準備
必要なライブラリのインポート
まずは必要なライブラリを読み込みます。
import tensorflow as tf
from tensorflow.keras.datasets import mnist
from tensorflow.keras.models import Sequential
from tensorflow.keras.layers import Dense, Activation
from tensorflow.keras import utils
import matplotlib.pyplot as plt
from tensorflow.keras.utils import plot_model
from sklearn.metrics import accuracy_score, f1_score, precision_score, recall_score, confusion_matrix
import numpy as np
import plotly.express as px

print("Tensorflow version " + tf.__version__)GPUの読み込み
GPUがある場合は認識して使えるようにします。
os.environ['TF_CPP_MIN_LOG_LEVEL'] = '2'    # Suppress TensorFlow logging (1)
tf.get_logger().setLevel('ERROR')           # Suppress TensorFlow logging (2)

if tf.test.is_gpu_available():
    gpus = tf.config.experimental.list_physical_devices('GPU')

    for gpu in gpus:
        tf.config.experimental.set_memory_growth(gpu, True)

    print("GPUの読み込みが完了しました")

else:
    print("GPUが存在していません")
    device_lib.list_local_devices()
データセットの準備
データセットのダウンロード
mnistのデータセットはtensorflowの関数を使って簡単にダウンロードすることができます。
# kerasのMNISTデータの取得
(train_images, train_labels), (test_images, test_labels) = mnist.load_data()
データセットの確認
mnistデータセットの中身を確認していきましょう。
print(train_images.shape)
print(test_images.shape)28×28ピクセルの画像が70000枚(学習用60000枚、テスト用10000枚)入っていることがわかります。
ラベルには書いた数字が何なのか答えが格納されています。
print(train_labels.shape)
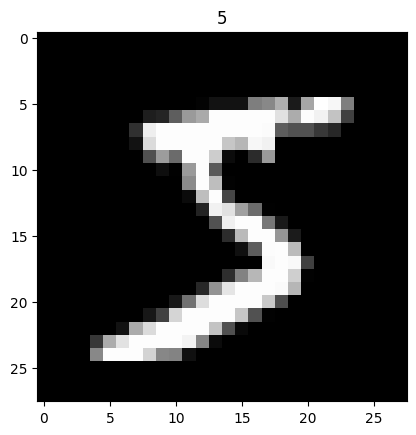
train_labels試しに1枚目の画像とラベルの組み合わせを表示してみました。
plt.imshow(train_images[0], cmap='gray')
plt.title(train_labels[0])
plt.show()
5と書いてある画像とラベルが格納されていることがわかります。
データセットを扱いやすい形式に変換
正解ラベルをonehot形式に変換します。
# 正解ラベルをonehotに変換
train_labels_onehot = utils.to_categorical(train_labels)
test_labels_onehot = utils.to_categorical(test_labels)

print(train_labels_onehot)
モデルの作成
モデルの定義
全結合層を使った簡単なモデルを作成します。
# ネットワークの定義
model = tf.keras.models.Sequential([
    tf.keras.layers.Flatten(input_shape=(28, 28)),
    tf.keras.layers.Dense(128, activation='sigmoid'),
    tf.keras.layers.Dense(10, activation='softmax')
])

model.summary()インプットは画像サイズの28×28として、最終層はクラス数の10を指定しています。
モデルのコンパイル
損失関数や最適化アルゴリズムを設定して、モデルのコンパイルを行います。
# 損失関数,最適化アルゴリズムなどの設定 + モデルのコンパイルを行う
model.compile(loss='categorical_crossentropy', optimizer='sgd', metrics=['accuracy'])
モデルの学習
エポック数5で学習をします。
epoch_num = 5

# validation_split=0.1 ---> 0.1(10%)の訓練データが交差検証に使われる
hist = model.fit(train_images, train_labels_onehot, batch_size=200, verbose=1, epochs=epoch_num, validation_split=0.1)
バリデーションデータで90%の正解率まで学習できました。
学習の推移を可視化
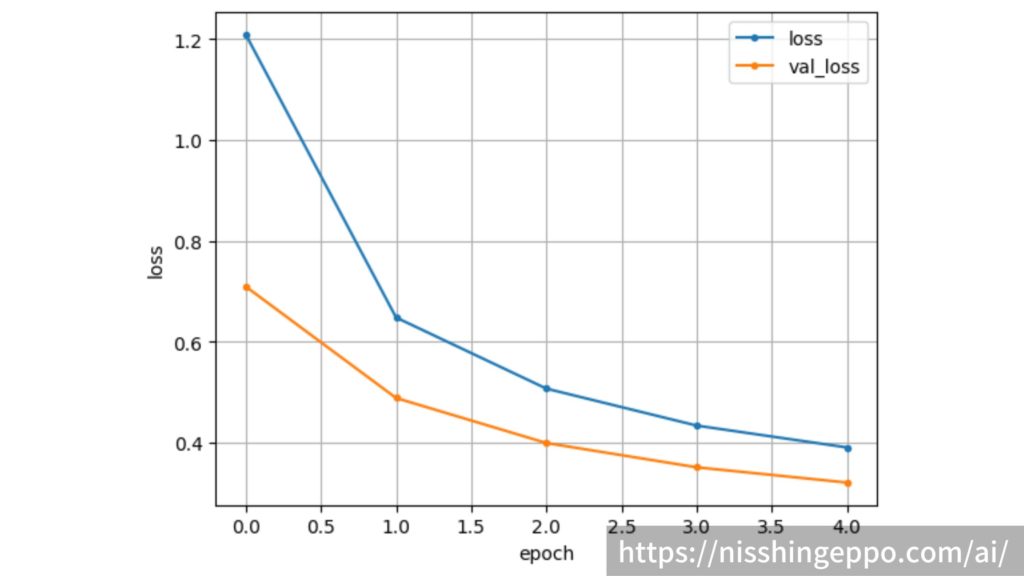
エポックごとのloss関数と正解率の推移を確認していきます。
まずはloss関数です。
# loss関数の描画
loss = hist.history['loss']
val_loss = hist.history['val_loss']

# lossのグラフ
plt.plot(range(epoch_num), loss, marker='.', label='loss')
plt.plot(range(epoch_num), val_loss, marker='.', label='val_loss')
plt.legend(loc='best', fontsize=10)
plt.grid()
plt.xlabel('epoch')
plt.ylabel('loss')
plt.show()
学習を進めるごとにloglossが下がっていき、うまく学習できていることが確認できました。
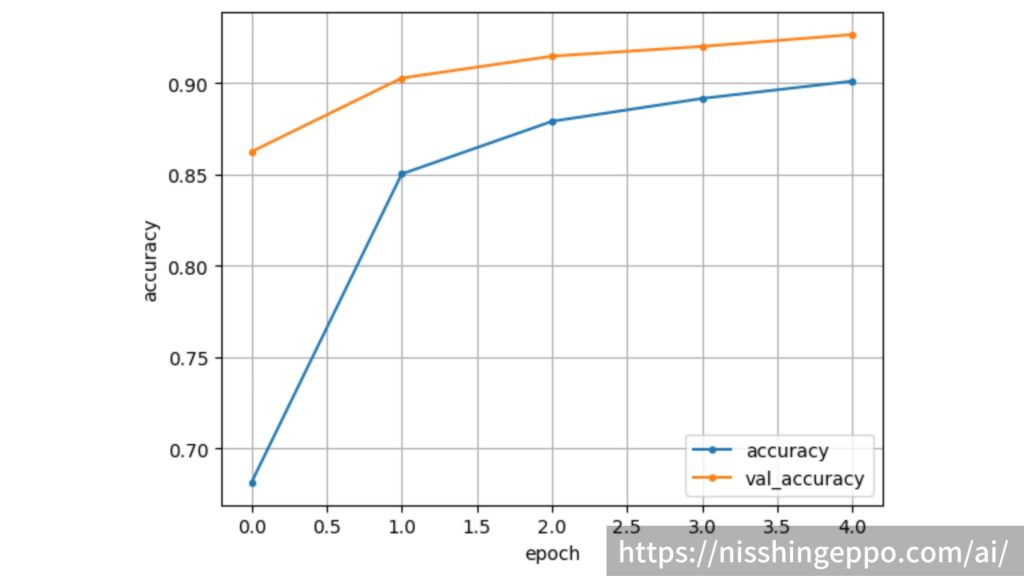
次に正解率です。
# 正解率の描画
acc = hist.history['accuracy']
val_acc = hist.history['val_accuracy']

# accuracyのグラフ
plt.plot(range(epoch_num), acc, marker='.', label='accuracy')
plt.plot(range(epoch_num), val_acc, marker='.', label='val_accuracy')
plt.legend(loc='best', fontsize=10)
plt.grid()
plt.xlabel('epoch')
plt.ylabel('accuracy')
plt.show()
正解率も順調に上がっていることが確認できます。
テストデータの推論
テストデータの推論
完成したモデルを使ってテストデータに対して推論を行います。
predict_result = model.predict(test_images)
print(predict_result)各クラスに所属する確率が推論結果として返されます。
推論結果の確認
このままだと分かりづらいので、一番確率の高い結果のみ抽出します。
cm_predictions = np.argmax(predict_result, axis=-1)
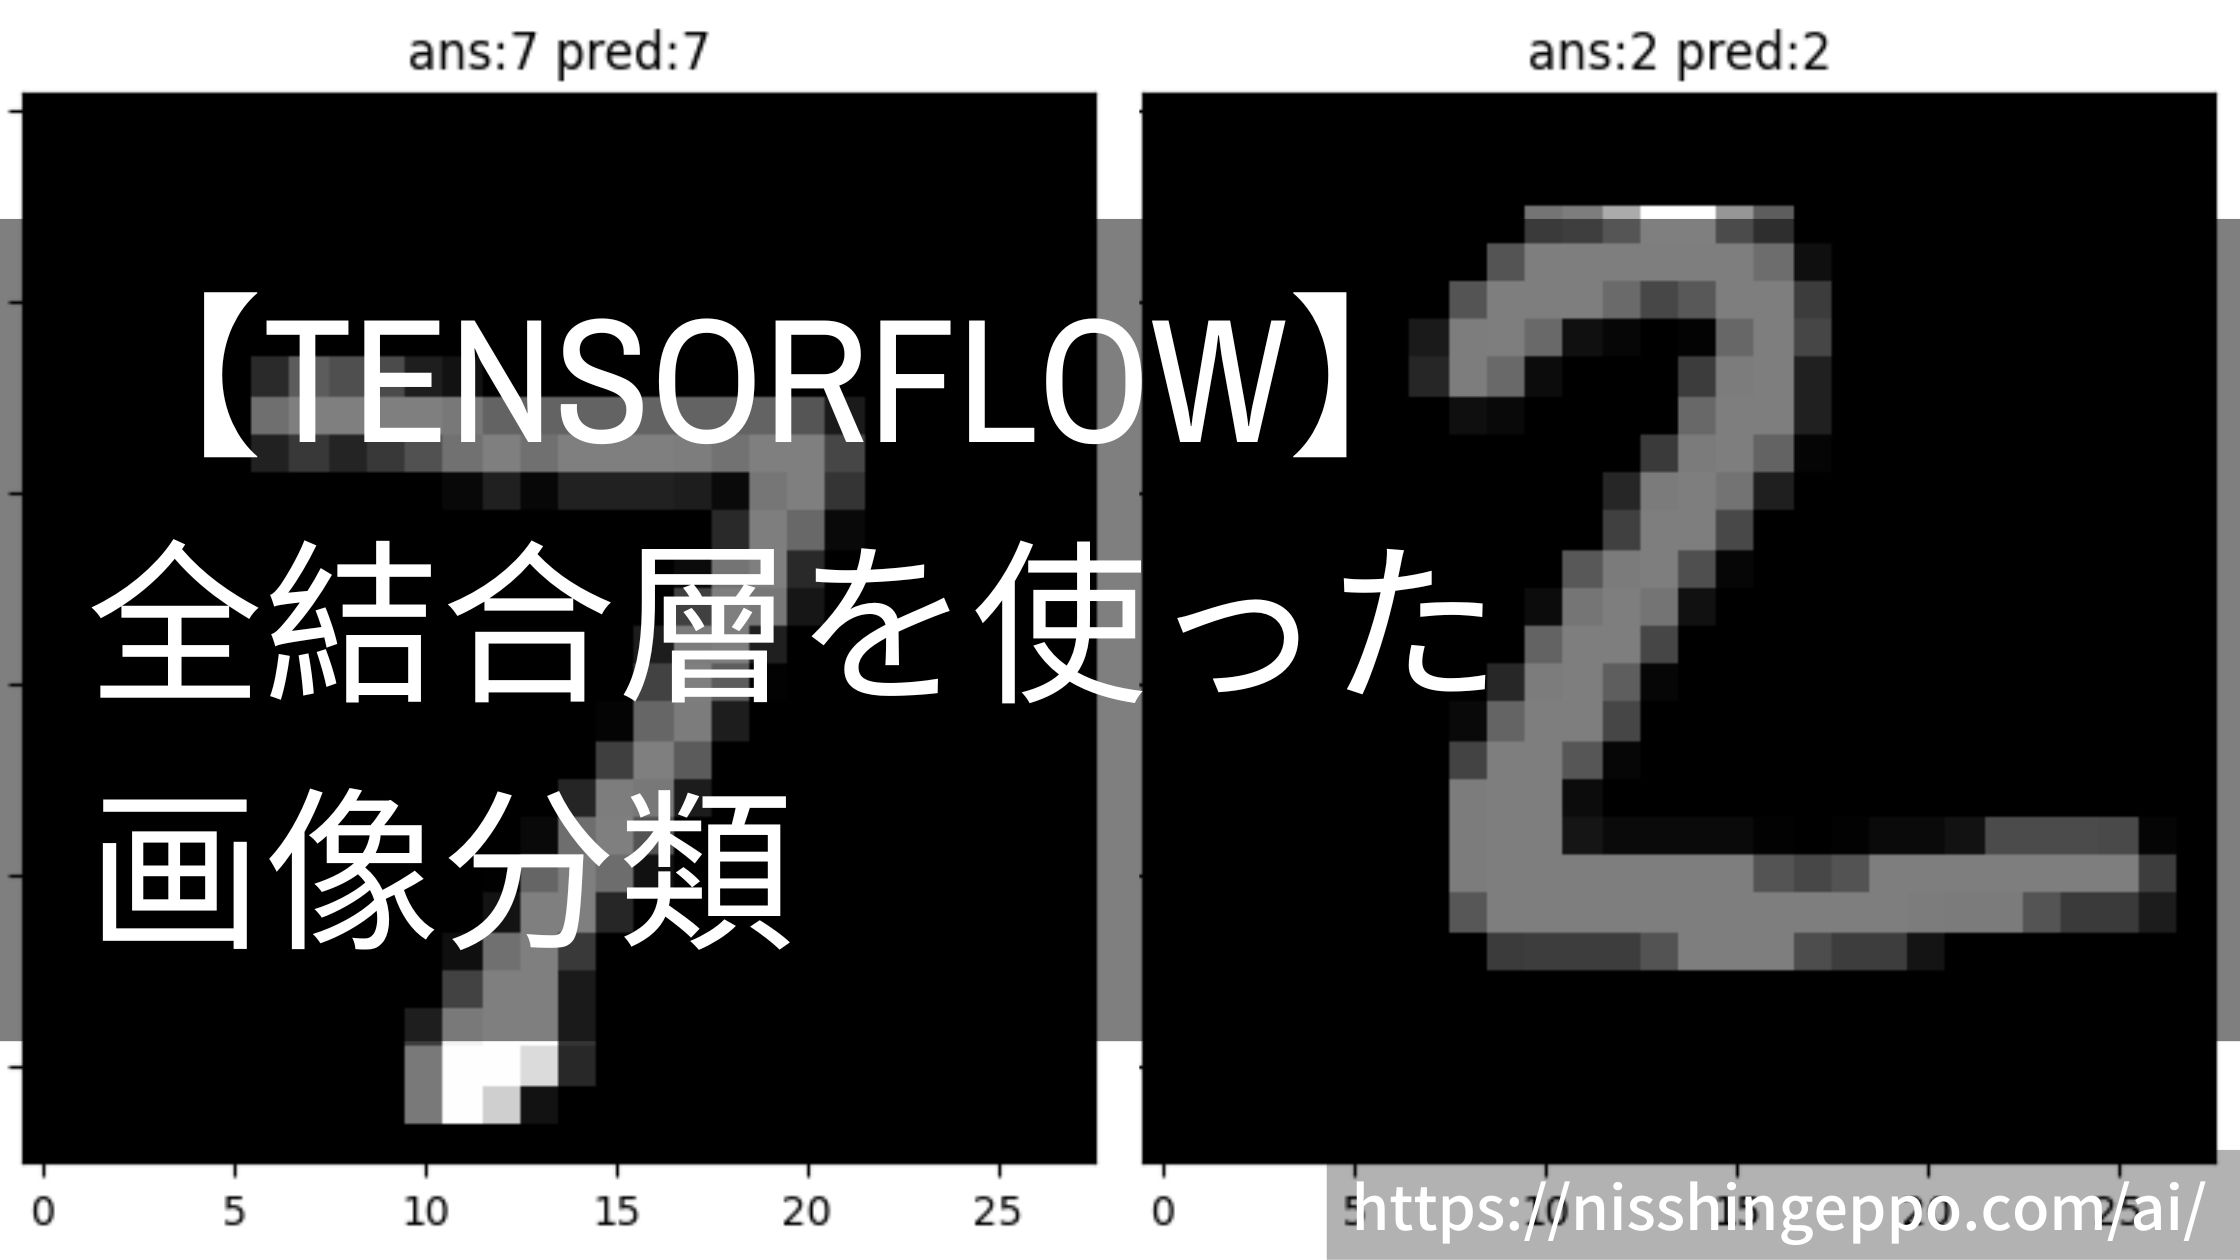
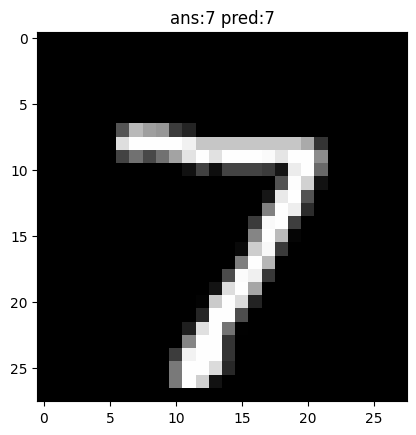
print(cm_predictions)一枚目の画像は7と予測していました。
画像を確認してみましょう。
plt.imshow(test_images[0], cmap='gray')
plt.title(f"ans:{test_labels[0]} pred:{cm_predictions[0]}")
plt.show()
きちんと予測できていることがわかりました。
推論精度の確認
テストデータに対してどのくらいの精度で予測できていたのか計算します。
それぞれの指標値の意味はこちらで解説しています。
正解率(Accuracy)
まず、正解率を算出します。
accuracy = accuracy_score(
    test_labels,
    cm_predictions
)

print(f"Accuracy: {accuracy}")
正解率約90%の精度で予測できていました。
適合率(Precision)
次に適合率を算出します。
CLASSES = ['0', '1', '2', '3', '4', '5', '6', '7', '8', '9']
labels = range(len(CLASSES))

precision = precision_score(
    test_labels,
    cm_predictions,
    labels=labels,
    average='macro',
)
print(f"Precision: {precision}")適合率約90%の精度で予測できていました。
再現率(Recall)
続いて再現率を算出します。
recall = recall_score(
    test_labels,
    cm_predictions,
    labels=labels,
    average='macro',
)
print(f"Recall: {recall}")再現率約90%の精度で予測できていました。
F値
最後にF値を求めていきます。
score = f1_score(
    test_labels,
    cm_predictions,
    labels=labels,
    average='macro',
)

print(f"F1-score: {score}")F値も約0.90で、全体的にバランスよく予測できていることがわかります。
推論結果の分析
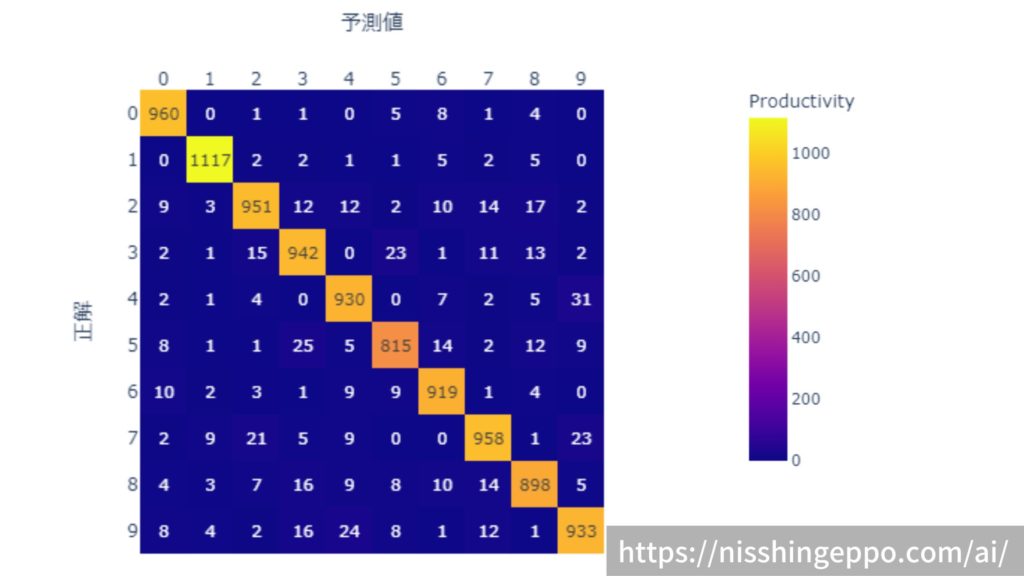
混同行列を作り、予測の傾向を分析してみます。
cmat = confusion_matrix(
    test_labels,
    cm_predictions,
    labels=labels,
)

cmat_normalize = (cmat.T / cmat.sum(axis=1)).T  # normalize
print(cmat)
混同行列を作成しましたが、分かりづらいので可視化してみます。
fig = px.imshow(
    cmat,
    text_auto=True,
    labels=dict(x="予測値", y="正解", color="Productivity"),
    x=CLASSES,
    y=CLASSES
)

fig.update_xaxes(side="top")
fig.show()
大半が正解できていますが、3と5を間違えやすいというような傾向を読み取ることができます。
おまけ(個別で画像を推論)
testデータをまとめて10000枚一気に推論していきましたが、自分で用意した画像などを1枚推論する場合は画像の形式を整えてから推論する必要があります。
target_image = tf.keras.preprocessing.image.img_to_array(test_images[0]).reshape(1, 28, 28, 1)
target_image.shape
推論は同様にpredict関数で行うことができます。
predict_result = model.predict(target_image)
print(predict_result)
まとめ
tensorflowを使ってmnistの推論を行うことができました。
モデルを作り、学習し、推論し、分析といった流れはどんなAIを作る上でも共通の進め方となります。
参考文献









コメント